Microscopy
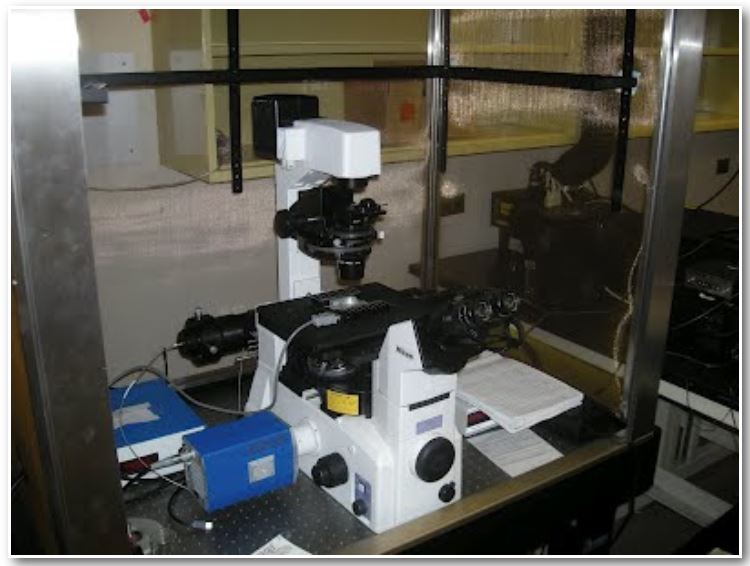
The Khoshbouei lab is currently equipped with 7 Nikon and 1 Zeiss microscopes as well as an EVOS Cell Imaging System. Current capabilities include TIRF, laser-scanning confocal, FRAP, FRET, high-speed calcium imaging, and much more all contained within 37C and 5% CO2 controlled environments. We are currently using this microscope to study the interactions between DAT and many other proteins such as alpha-synuclein, sigma-1 receptor, and Kv1.1 in neurons and macrophages.

Nikon A1 Laser-scanning confocal

Zeiss Axioscope

Nikon equipped with Andor Zyla and Polygon400 Photostimulator
Example Methods:
Intracellular Calcium Mobilization
Cells stably expressing YFP-DAT, YFP-S/A-DAT, YFP-S/D-DAT, or parental nontransfected EM4 cells were plated on glass bottom microwell dishes (MatTek Corp., Ashland, MA) 48 h before the experiments. Cells were loaded with the cell-permeant, Ca2+-sensitive dye Fura 2-AM (5 μm) (Molecular Probes, Carlsbad, CA) for 30 min at 37 °C, washed three times in external solution, and acclimated to room temperature for 10 min. The dishes were mounted on an inverted Nikon TE2000E microscope at room temperature. Images were collected using a 40×, 1.3 NA, oil immersion Plan Fluor objective lens, and a side-mounted CoolSNAPHQ2 camera. Fluorescence was monitored using dual excitation wavelengths (340/380 nm) and a single emission wavelength (510 nm). Fluorescence at 340 nm indicates dye bound to Ca2+, whereas that at 380 nm corresponds to free dye. Basal readings were taken for 60 s before addition of METH or AMPH (10 μm). In some experiments cells were incubated with either COC (10 μm), thapsigargin (2 μm), or CdCl2 (2 mm) for 5 min before stimulation of the cells with AMPH or METH. Nikon Elements Advanced Research imaging software (Nikon Instruments) was used for automated collection of images at ∼1-s intervals over a 5-min period. During this time, cells maintained a healthy morphology.
Images of cells expressing YFP-DAT were taken with a FITC HyQ filter cube before and after the addition of METH or AMPH. Only cells expressing detectable YFP-DAT signals were included in the analysis. Average fluorescence measurements were determined using Nikon Elements software. Data are expressed as the ratio of bound:free (340/380 values) Fura 2-AM fluorescence intensities after background subtraction. For time-matched statistical analysis, the Ca2+ levels were normalized to the average fluorescence intensities (340/380 values) of basal values (first 60 images).
As a positive control for cell viability and for FURA-2 AM function, 5 μm ionomycin was added at the termination of all calcium mobilization assays. More than 95% of the cells exhibited a rapid increase in internal Ca2+ in response to ionomycin, and only ionomycin-sensitive cells were included in the analysis.

Confocal Microscope
TIRF Laser Microscope